How to reduce Zabbix Queue length
If the Zabbix Queue (visible from Administration → Queue in the WebUI) has too many delayed items, you have a performance issue. I'm will provide a few tricks to cope with this issue.
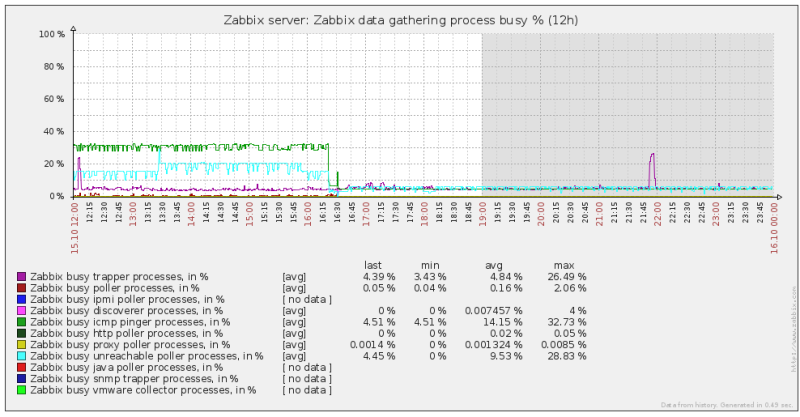
Zabbix has a very nice way of monitoring internal performance, which is the percentage of time a component is in BUSY state. In Monitoring → Graphs select your server and your proxies and have a look at Zabbix Data gathering process busy %, Zabbix internal process busy % and Zabbix proxy/server performance graphs.
Then tune the number of processes, incresing the number of started processes for those items which are overloaded.
To do that, open the Zabbix Server configuration file zabbix_server.conf and increase one or more of the following configuration parameters
StartPollers=
StartPingers=
StartPollersUnreachable=
StartIPMIPollers=
StartTrappers=
StartDBSyncers=
For example, I increased StartPollersUnreachable and StartPingers in my configuration file. After restarting Zabbix server, the load dramatically dropped, as shown below.
Repeat the same for all your Zabbix Proxies and check your Zabbix Queue.
If this first solution improves things but there are still too many queued items in your proxies, it may be a matter of time (timestamp, to be precise).
I solved installing ntp on both the server and all the proxies.
In Ubuntu/Debian you can install ntp with
apt-get install ntp
and re-configure the timezone with
dpkg-reconfigure tzdata
and check your local time with
date
After synchronizing clocks, Zabbix queue should slowly decrease and eventually become empty.
